urbanism – landscape – ideas – theory – whimsy

Analyzing Urban Form by Block Shape and Size

The block pattern of Paris in map form and arranged by shape and size

French artist Armelle Caron has created a series called “tout bien rangé” in which the block patterns of various cities have been disassembled, sorted by shape and size and rearranged as a new graphic representation of the city. While the result of the taxonomicalish classification and reorganization is not particularly useful from an urban design perspective (the city maps don’t seem to be at the same scale, for one), it’s certainly an interesting way to look at the city, and to think about blocks, block size and block shape, which are such an integral and enduring element of our cities’ urban forms. See all of the pieces on the artist’s site. (via Strange Maps)

For something similar see The Patterns of the Urban Fabric of Beijing’s Hutong.

The block pattern of New York (part of Manhattan and part of Brooklyn) in map form and arranged by shape and size


The block pattern of central Berlin in map form and arranged by shape and size

Toronto From the Perspective of Flickr and Twitter

Toronto from the perspective of Flickr and Twitter: Red dots are locations of Flickr pictures. Blue dots are locations of Twitter tweets. White dots are locations that have been posted to both (image: Eric Fischer at Flickr.com). Move over with mouse to see Google Map overlay to locate yourself.

An interesting (and beautiful) set of maps have been made by Flickr user Eric Fischer showing maps of the locations of Flickr photos and Twitter activity in major urban centres around the world (see the full set called “See something or say something” to compare to other cities). What’s interesting is how clearly the downtown street fabric of Toronto (and other cities) is revealed by people’s photos and tweets. While it might seem obvious that the streets (being our main public realm) are the places where the most concentrated activity of this kind takes place, it still suggests things about how people use the city and of what and where they choose to take photos. Outside the core, the main photo concentrations appear to be the waterfront and major parks, with a few splotches at major urban nodes which suggests a large preference for taking photos of the natural environment. Meanwhile the Twitter activity is much more evenly spread across the city, although still concentrated enough around the major streets of the city to give a suggestion of the street network. The clarity with which Yonge St, Bloor/Danforth and Queen St stand out shows just how much activity in general in Toronto is concentrated around these three streets that most of us know are the main spines of the city. If only Queen St had a subway line recognizing this to match the other two!

Image 01

Tahrir Square, Cairo – From Traffic Circle to Civic Square

Annotated photo from BBC (over Reuters photo) of Tahrir Square, Cairo at the height of the protests (click through to BBC to read the annotations

Tahrir Square in central Cairo became the nucleus for unprecedented protests against the government in Egypt in February. While the name Tahrir means Liberation (referring to the Egyptian revolution against British rule in 1919, but subsequently co-opted to also refer to the 1952 military coup that removed the Egyptian monarchy and established the modern Republic), the space itself normally hardly serves as a great civic square, being for all intents and purposes a huge traffic circle.

Tahrir Square area from Google Maps

But it just goes to show that the utility of a civic square lies as much in its imagined symbolic role as in its intended programme and design – the key requirement is largely that the space is simply open. It doesn’t matter if it’s legally accessible, or if the law allows peaceful assembly. In times of crisis or great importance, people will gather in the place that captures the public imagination. After all, traffic is certainly no obstacle to a revolution.

Tahrir Square - Daily Mail (Associate Press) photo

Tahrir Square on Friday of Departure (Feb 4th) by Flickr user Mona Sosh

Crowds in Tarhrir Square (Photo: AP/Tara Todras-Whitehill)

Friday prayers by the Tahrir Square demonstrators, photo by Amr Addullah Dalsh (Reuters via Calgary Herald)

Sub-Prime Crisis in Cleveland

cleveland_2.gif

BBC News presented this set of maps in an article on the sub-prime crisis in the US (The US sub-prime crisis in graphics). Cleveland has been particularly hard hit by housing foreclosures, as the maps show, but when “one in ten homes in Cleveland had been repossessed” (as of late 2007) and “Deutsche Bank Trust, acting on behalf of bondholders, was the largest property owner in the city”, you begin to grasp the true horrible scale of the problem and are left wondering if this is the tip of the iceberg.

Mapping Our Urbanism Part VI – Income

toronto-3cities_2.gif

This animated map showcases the datum bookends of the excellent publication The Three Cities within Toronto: Income polarization among Toronto’s neighbourhoods, 1970–2000 by David Hulchanski from UofT‘s Centre for Urban and Community Studies (downloadable from their website). Income levels are shown as census tract averages as relative to the average for the Toronto CMA – the light pink is middle income (20% below to 20% above average), with the most interesting change occurring between that and the darker pink representing low income areas (20% to 40% below average).

The geographic explosion of lower incomes into the inner suburbs of north Etobicoke and Scarborough is almost stunning, but I think reflects a lot of our current received wisdom about the changes taking place in Toronto, in particular gentrification in old inner city neighbourhoods and the consolidation and bulwarking of high income areas. In short, it speaks volumes about housing affordability in the currently valued neighbourhoods of the city, and indicates that those who can afford to are abandoning many of the inner suburbs.

toronto-3cities_orig-sm-e.jpg

The more famous map from “The Three Cities” report is this one (above), which highlights those areas with the biggest increases (blue hatch) and decreases (dark brown) in average income between 1970 and 2000 – in this case, white areas are considered relatively stable. As you can see, looking at it this way clearly shows both gentrification at work and that the census tracts with the largest decreases in average income are almost all in the inner suburbs.

Hulchanski calls this a dramatic polarization and segregation of the city based on income, and firmly makes the point that we are capable of addressing this trend through better policies on housing affordability and requiring more affordable units in new developments to ensure that mixed income neighbourhoods are the norm instead of the exception: in his words “The segregation of the city by socio-economic status need not continue. It can be slowed and reversed.”

Crossposted to spacing toronto as part VI of a series – to view the five earlier parts follow these links:

Mapping our urbanism Part V – watersheds

Mapping our urbanism part IV – language

Mapping our urbanism part III – water mains

Mapping our urbanism part II – extents

Mapping our urbanism part I – snow ploughing

Urban Fabric & Form Comparison

urban form comparison

The Star today published a cover story (Beyond Density) in their Condos section on the efforts in Mississauga to create a more vibrant and pedestrian-friendly downtown – key among the problems identified has been the large scale of the block patterns in Mississauga – to prove the point the article includes urban form/fabric drawings of 9 cities (one hopes at the same scales) in order to compare the scales of the fabric of the street network. I include the drawings below alphabetically (with Mississauga first).

(edit: a friend requested I lay out all the drawings in a grid for easier comparison – I hope you enjoy – click on the above image for a larger version)

More than anything, the comparisons expose the inherent problems of scale in trying to evolve any suburban, auto-oriented area into a more pedestrian-oriented centre. The traditional response in suburbia has been to internalize pedestrian areas (in the form of the mall), Square One (home to the largest Walmart in the world) being a particularly powerful example, though Scarborough Town Centre might be the more classic one. The size of Square One’s block makes a very interesting comparison with Copenhagen’s city centre (3rd below) in which a series of streets and spaces have been linked together and pedestrianized (view a map of the pedestrian areas of Copenhagen from Metropolis magazine). In size or length of pedestrian space, the two might even be close, but in overall character and degree of integration into the urban fabric (particularly important for pedestrians) they are from wholly different worlds and you can easily trace much of these differences to the scale of the street fabric.

The other striking lesson from such comparisons is that there really is no perfect form of street fabric – many different networks and patterns are capable of producing wonderful places and being friendly for pedestrians as long as their fabric allows frequent and comprehensive linkages – there simply seems to be an upper scale beyond which all hope of efficient (and therefore popular) pedestrian circulation is gone.


MISSISSAUGA: “Long blocks and virtually empty sidewalks”

Barcelona Urban Fabric
BARCELONA: “La Ramblas is the main north-south promenade”

Copenhagen Urban Form
COPENHAGEN: “City features a car-free zone called the Stroget”

London Urban Form
LONDON: “The Mayfair and Soho districts south of Oxford St”

New York Urban Form
NEW YORK: “Midtown Manhattan south of Central Park”

Paris Urban Form
PARIS: “Streets were designed by Georges-Eugne Haussmann”

Rome Urban Form
ROME: “East of the Tiber River bend that points to the Vatican”

San Francisco Urban Form
SAN FRANCISCO: “Market St splits the central city into two grids”

Toronto Urban Form
TORONTO: “Between Queen and College Sts east of Bathurst”

Mapping Our Urbanism Part V – Watersheds

080113_watersheds-e_sm.jpg

Along with its article today about the TRCA‘s work preserving watersheds in the GTA (Clock is ticking for conservation dream), The Star included a beautiful map of the major watersheds flowing south from the Oak Ridges Moraine through Toronto (click on the image for a larger version). The article describes some of the difficulties the TRCA is having in expanding its protection in the upper reaches of many of the watersheds.

The Star poetically continues:

“Stripped of political boundaries and roads, the GTA map resembles a vast network of watery arteries originating in the Oak Ridges Moraine and emptying into Lake Ontario.”

The original PDF (watch out, 9MB) can be downloaded from their site.

Crossposted to spacing toronto as part V of a series – to view the four earlier parts follow these links:

Mapping our urbanism part IV – language

Mapping our urbanism part III – water mains

Mapping our urbanism part II – extents

Mapping our urbanism part I – snow ploughing

Mapping Our Urbanism Part IV – Language

gta-language-quilt_main-e.jpg

The Star included a map of “Greater Toronto’s language quilt” in their Ideas section today compiled based on recently released 2006 census data. The map is hidden away on their website in a massive (c. 20MB) pdf file (if you dare, here’s the link), so here are some more easily digestible images of the spread’s content (click to enlarge).

While we love to trumpet Toronto’s diversity, it’s nice to have some statistical proof to back up our claims. It’s pretty fascinating that the second largest language group in the GTA (by mother tongue) only represents 3.5% of the population, and yet with only 56% of the GTA reporting English as a mother tongue, the balance of 44% is made up of an incredibly diverse group of languages.

The Star describes their methodology for the creation of the main map (above):

BUILDING THE MAP OF SECOND LANGUAGES
Our challenge was to show the many language communities while retaining the areas where English overwhelmingly dominates:
– Only languages that ranked second in at least 5 census tracts are shown on the map.
– To replace English — the dominant language in 95% of census tracts — the second language must be above its GTA average.
– If languages were tied, the census tract was assigned to the language that was highest compared to its own GTA average, representing a more significant pocket.

gta-language-quilt_eng-2nd-e.jpg

gta-language-quilt_top-new-e.jpg

Crossposted to spacing toronto as part IV of a series – to view the three earlier parts follow these links:

Mapping our urbanism part III – water mains

Mapping our urbanism part II – extents

Mapping our urbanism part I – snow ploughing

A sense of scale, a sense of space, a sense of place?

Construction Hoarding on St. Thomas
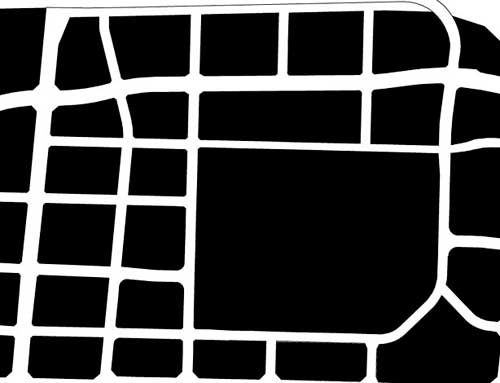
Photo: St. Thomas St, Yorkville

A second construction hoarding was erected on St. Thomas St south of Bloor recently, across the street from an existing hoarding (which has since been taken down). For a short time, the two facing hoardings protecting the sidewalks appeared to resemble a street lined with arcades, in its small spatial scale not unlike many you will see in southeast asia, such as this one in Singapore.

Street with arcades, Singapore
Photo: Street/lane in Singapore

This small scale of space is a relatively infrequent occurrence in Toronto, especially as part of a public street. While we’re used to such small scales in our back alleys, those alleys are, with but few exceptions, the city’s backdoors – infrequently travelled and largely empty, with few uses facing on to them other than the occasional residence and dominated by garages or blank walls and service entries. They do not really form a part of the public face of the city or city life.


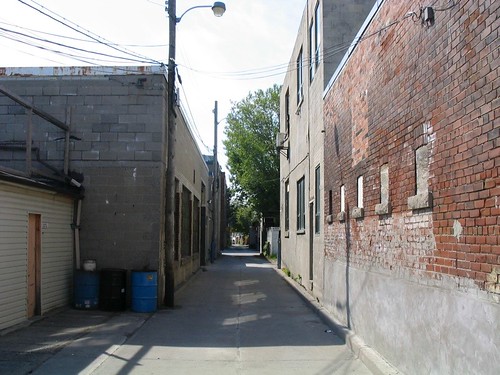
Photo: Laneway in the Junction


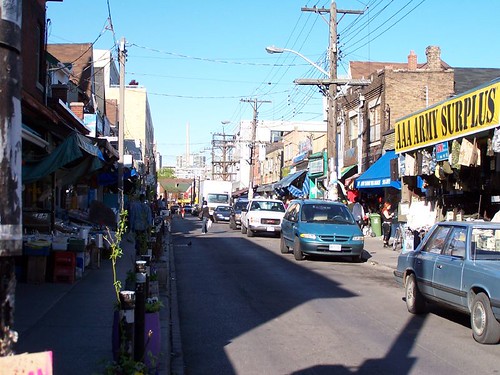
Photo: Kensington Market (photo by raptortheangel)

Somewhere approaching this scale of space that is part of the public face of the city is most famously exemplified by Kensington Market, where not only the buildings, produce and products are jostled up against the sidewalk, but the streets are narrow and bustling with people, and to add to the compression of space, filled with parked cars and delivery trucks and slowly crawling traffic. It all adds up to a very human (dare we say humane?) scale that somehow makes you feel comfortable, as though you’ve been enveloped in the city. In fact, Kensington moves beyond a sense of space, and somehow transcends that rather empty word, to have evolved a sense of place, one that is both undeniable and unique.


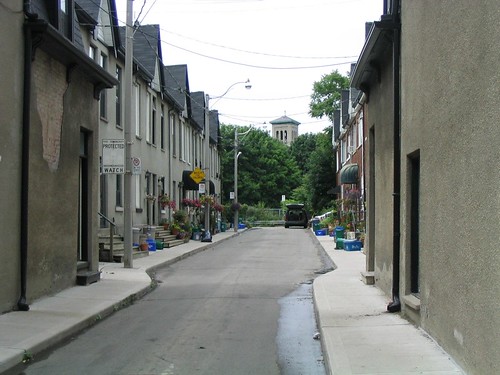
Photo: Wilkins Ave, off King St E, east of Parliament

There are a few other examples of small space in the city, but they tend to be rather hidden and brief moments – although that just makes them seem all the more jewel-like when you discover them.


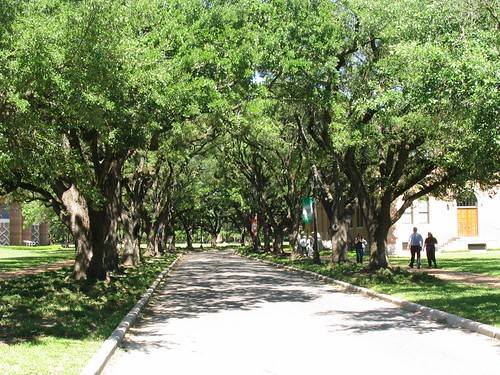
Photo: Tree-lined street at Rice University, Houston

While small space is not the only way to attempt to foster sense of place, I think that there is some connection between this sense of scale, sense of space and sense of place. Similar effects of scale can even be created by the canopies of closely-spaced street trees, as at Rice University (above), but can also be misguided in implementation as in this accident of line-of-sight where Casa Loma’s tower is perfectly framed by the laneway between Walmer Rd and Spadina Rd south of Davenport, which doesn’t so much benefit the laneway itself, but creates some sense of drama and intrigue for all those people walking along MacPherson Ave towards George Brown College.


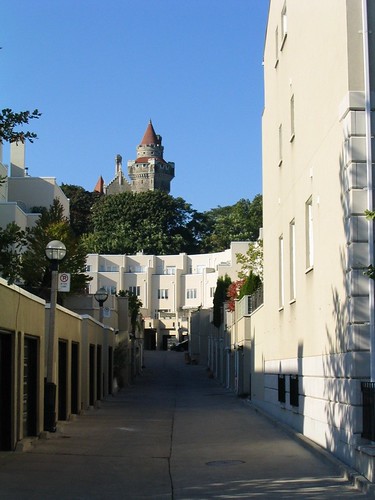
Photo: Looking towards Casa Loma up rear lane between Walmer Rd and Spadina Rd

Whether or not anyone agrees with me about the importance of small scale when it comes to sense of place, I think we can safely say that a key missing ingredient in the urbanities being created in suburban locales around Toronto (and the rest of north america) is the absence of small-scaled space. This absence has been compensated for in many different ways, but most notably (need I say, horrifically and ironically?) by the deliberately pedestrian scale of space of the “shopping street” inside the typical mall and, more recently, by the creation of “pedestrian-oriented” centres in suburban locales, usually surrounded by seas of parking and/or parking garages and huge arterial roads and/or expressways. These new “centres”, sometimes presumed to be the end of the mall (and often replacing them), are in reality the mall’s evolution into a more plausible (but still staged) “reality”, one that is once again based upon the smaller scale that has become nostalgically associated with our cities’ historic centres and main streets.

Whether this small scale can once again be more fully integrated into the urban environments we are building may depend on the level of commitment we as a society are willing to make to creating spaces and places planned and designed around people instead of cars. On this question the jury’s still out. Despite recent progress and a lot of talk to the contrary, the evidence on the ground does not convince.

Mapping Our Urbanism Part III – Water Mains

to_watermains_early2_e.jpg

In the Toronto Star last weekend was a special 2-page spread on the sorry state of Toronto’s water mains with emphasis on who’s to pay for upgrades (see story online here). However, the maps included give a fascinating glimpse into the history of Toronto’s development seen through the age of the water mains. Divided into four periods, 1859-1900, 1901-1940, 1941-1960, and 1961-2000, these maps are indispensable for anyone interested in the history of urban infrastructure. To see a little more detail, follow these links (maps 1+2, maps 3+4) – if you prefer a much more detailed PDF version of the maps is available from the Star’s site here (PDF).

to_watermains_modern2_e.jpg

Crossposted to the Spacing Wire